Documentation
Everything you need to clean, analyze, visualize, and model a dataset in Pivot.
Overview
Pivot is a desktop data-analysis application for cleaning, analyzing, visualizing, and modeling tabular data. Instead of writing code, you build a pipeline by dropping tools into a visual stack, and the results update as you go.
- Fast on large files. Data is kept in DuckDB on disk rather than loaded fully into memory. Each step contributes to a single query that only runs when needed.
- Visual and reorderable. Every step is editable, and you can change the order of steps and see the pipeline re-run.
- Local by design. Your data and the AI assistant run on your own machine. Claude is optional, with your data masked.
Quick start
- Open a dataset. Open the File menu, choose Open File, and pick a CSV or Excel file. A short dialog lets you import it as-is, or pick out just the columns you want (see Importing files).
- Add a tool. Find a tool in the toolbox and either drag it into the work stack or click it to add it.
- Fill in its inputs. Pick the columns and options the tool asks for. The result appears as soon as the step runs.
- Keep building. Chain more steps: clean, transform, then analyze or chart. Drag steps to reorder them.
- Save your work. Save the session as a
.pivotfile, or export the result to CSV. Pivot also autosaves, so your last session is waiting for you next time.
Tip: not sure where to go next? The AI assistant suggests next steps based on your data, such as a chart after an Aggregate, or a warning about columns with many missing values.
Signing in
The first time you start Pivot on a computer, it asks you to sign in with Google.
- Click Continue with Google. Your web browser opens on Google's sign-in page.
- Choose your account. When you finish, return to Pivot. It notices automatically and opens.
Your email address then appears at the far right of the toolbar. Click it to see your subscription: your plan, its status (active, trial, canceled, or expired), and the date it is valid until, with the number of days left. If it has lapsed, a Renew subscription button takes you to the purchase page, and Refresh checks again.
You can see the same details on the website too: open My account, sign in with Google, and you'll find your plan, status, and expiry date, with a Sign out button.
Pivot remembers you on that computer, so you won't be asked again. Signing in needs an internet connection the first time, and the account needs an active subscription. If it doesn't have one, Pivot says so and offers a Get a subscription button, and you can try again with another account. Questions about access? Email info@buildfromscratch.in.
Your subscription
Pivot needs an active subscription. It checks yours when it starts, and shows how long it lasts under your email in the toolbar (see Signing in).
- Works offline. Pivot remembers its last successful check, so you can work without a connection. It keeps working offline for up to 30 days after that check, and never past the date your subscription ends.
- Checked while you work. Pivot re-checks every few hours while it's open, so a renewal or a cancellation is picked up without restarting.
- Your work is safe. Pivot autosaves as you go, so if it has to stop, your pipelines are restored the next time you open it.
When it expires
On the day your subscription ends, Pivot stops and shows Your subscription has expired, with three choices:
- Subscribe. Opens the purchase page in your browser.
- I've subscribed: sign in again. Once your subscription is active, sign in with Google again and carry on where you left off.
- Quit. Closes Pivot. Nothing is lost, but you'll be asked to subscribe and sign in again the next time you open it.
No connection when Pivot needs to check? It says it can't reach the server and offers Try again. This only happens if your last successful check is more than 30 days old, or your subscription's end date has passed.
The interface
Toolbar
The bar along the top has a File menu for everything to do with files, and a row of icon buttons for the rest. Hover over an icon to see its name.
| File › Open File | Open a CSV or Excel file. See Importing files. |
| File › Connect to Database | Load a table or query result from PostgreSQL, MySQL, SQL Server, or SQLite. |
| File › Save Session / Load Session | Save your work to a .pivot file, or open one. |
| File › Export as CSV | Save the current result as a CSV file. |
| Refresh | Re-run the pipeline against the source. |
| History (clock icon) | See everything you've done. See History. |
| Theme (sun / moon icon) | Switch between the light and dark theme. See Light & dark theme. |
| Check for Updates | Look for a newer version. See Updates. |
| Your email (far right) | Shows who is signed in. Click it to see your subscription. See Signing in. |
Toolbox
The toolbox lists every tool in four categories: Data Manipulation, Data Analysis, Data Visualization, and Modeling. Larger categories are split into labeled groups, and you can search for a tool by name.
Work stack
The work stack is your pipeline. Each tool you add becomes a step you can edit, reorder, or remove. Manipulation steps change the table that later steps see. Analysis, chart, and model steps read the table and show their results without changing it.

The card at the top shows the file the pipeline starts from and its size. The buttons in the work stack's header change the source file (see Changing the source) or clear every step.
You can keep several pipelines side by side. Use + above the table to start a new one, either empty or continuing from an existing pipeline. Right-click a pipeline's tab to rename it, duplicate it, copy or paste its steps, or delete it.
Results and charts
Statistical tests and models show their output alongside the step. Charts are interactive.

Light & dark theme
Pivot comes in a dark theme and a light theme. Switch between them with the theme icon in the toolbar, just left of Explain Table. It shows a sun while you're in the dark theme and a moon while you're in the light theme.
- Click the sun or moon. Pivot asks you to confirm, because it restarts to change the theme.
- Pivot restarts itself. Your work is autosaved first and reopens where it was.
Pivot remembers your choice the next time it starts. The theme switch needs Pivot 0.71 or later; see Updates. The sign-in window always uses the dark theme.
Importing files
When you open a CSV or Excel file (.csv, .xlsx, .xls),
Pivot shows an import dialog first. Most files just need Import: the columns
and their types are detected for you. (Parquet and JSON files open directly, without the
dialog.)
Advanced: extract columns by header
Some exports aren't one clean table. A report might have a title above the data, several tables stacked or side by side with blank rows between them, or the same table repeated further down. Open the Advanced section of the dialog to pull the data out anyway. The file is shown on the left, exactly as it is, and the result on the right.
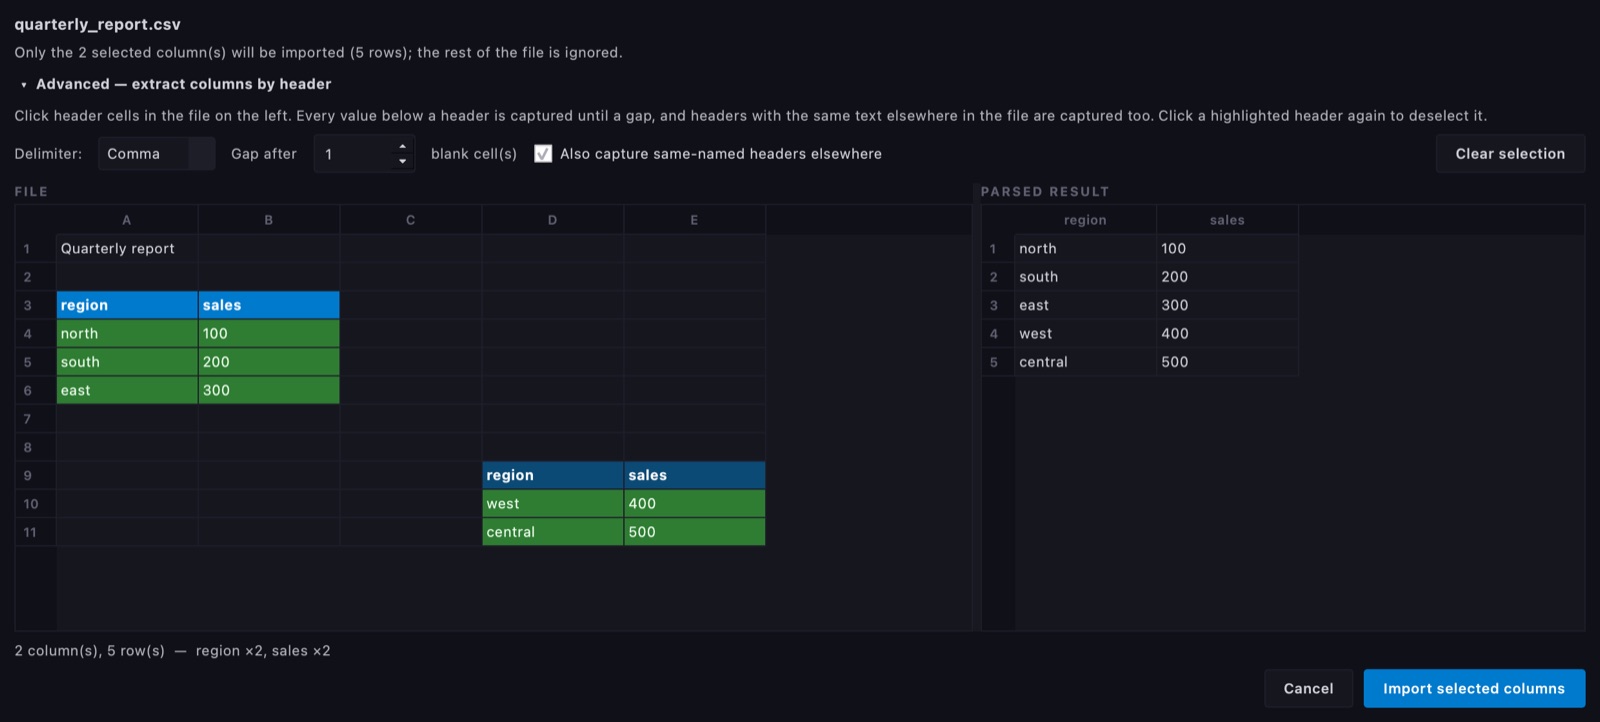
- Click a header cell in the file on the left, for example
region. It turns blue. - Everything below it is captured (green) until the first gap. Blank rows and blank cells end a column.
- Same-named headers are found for you. If
regionappears again further down or over to the side, it is highlighted in darker blue and its rows are added to the same column. Repeated page headers inside a table are skipped rather than treated as data. - Pick as many headers as you need. The right side shows the finished table as you click. Click a highlighted header again to deselect it, or use Clear selection.
- Click Import selected columns. Only those columns are imported and the rest of the file is ignored.
Options
| Gap after N blank cells | How many blank cells in a row end a column. Raise it if your data has occasional empty cells in the middle. Trailing blanks are always dropped. |
| Also capture same-named headers elsewhere | On by default. Turn it off to take only the headers you clicked, and nothing else in the file with the same text. |
| Delimiter | For CSV files: comma, semicolon, tab, or pipe. It's detected automatically, so change it only if the columns look wrong. |
| Sheet | For Excel files: which sheet to read. Switching sheets clears your selection. |
Good to know: when you pick several headers, tables that sit side by side stay lined up row for row, and a shorter column is padded with blanks. The preview shows the first 50,000 rows of a very large file, but the import reads the whole file. In Excel files, formulas are read as the value Excel last saved. A plain import (Advanced left closed) always uses an Excel file's first sheet.
Changing the source
Built a pipeline and now have a fresh version of the file, such as this month's export? Point the same pipeline at it instead of rebuilding it. Click the Change source button (the two arrows) in the work stack's header and choose the new file. It goes through the same import dialog as opening a file, so all of the options above apply.
- Your steps stay exactly as they are. Every step in every pipeline is re-run on the new data, and the card at the top of the stack shows the new file name.
- Missing columns are flagged first. If the new file has no column that some steps use, Pivot lists the columns and the steps that depend on them, and asks before going ahead. Choosing No leaves everything untouched.
- Safe to try. If the steps can't run on the new file, you can keep it anyway or go back. Going back restores your original file and pipeline.
- Joins keep working. The extra tables brought in by Join Tables are carried over to the new source.
Open analysis and chart windows close when the source changes, as they do when you open a file, since they were showing the old data. Run those steps again to see results for the new file.
History
The History button (the clock icon) in the toolbar opens a list of everything you've done, with the time and the pipeline each action happened in. It updates as you work, so you can leave it open beside the table.
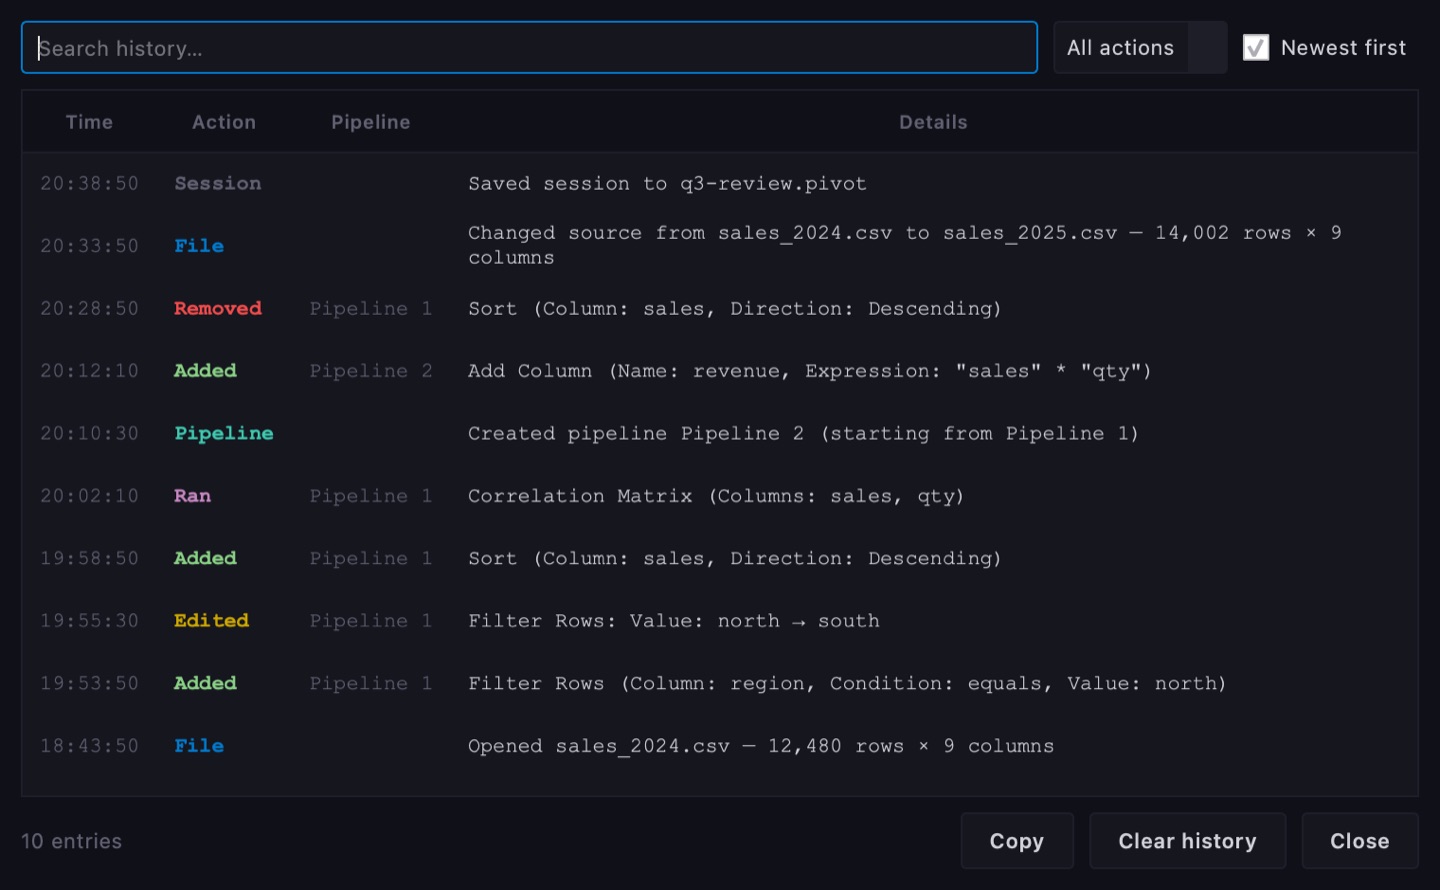
| File | Files opened, database connections, source changes, and exports. |
| Added / Removed / Moved | Steps added to, removed from, or reordered in a pipeline, including the step's settings. |
| Edited | What you changed in a step, such as Value: north → south. Several quick changes to the same step are recorded as one entry. |
| Ran | Analysis, chart, and model steps you ran. |
| Pipeline / Session | Pipelines created, renamed, duplicated, or closed, and sessions saved or loaded. |
Search the list, filter it by type of action, flip it between newest-first and oldest-first, or press Copy to put it on the clipboard as plain text. History is saved with your session, so it's still there when you come back. Clear history empties it. History is a record only: you can't click an entry to undo it.
Data manipulation
Tools that reshape and clean the table. Later steps in the stack see the changed data.
Rows & columns
| Add Column | Create a new computed column from an expression. |
| Select Columns | Choose which columns to keep. |
| Sort | Sort rows by a column, ascending or descending. |
| Filter Rows | Keep rows matching a column condition. |
| Remove Rows | Remove every row where a column equals a specific value. |
| Limit | Keep only a range of rows (from – to). |
| Remove Duplicate Rows | Drop duplicates based on the columns you choose. |
Cleaning & types
| Impute Missing Values | Replace missing values in a column with a value you specify. |
| Cast Column | Change a column's data type. |
| Remove Text | Strip every occurrence of a substring from a column's values. |
| Parse Number Range | Convert an "X .. Y" range string (e.g. owner counts) into its numeric midpoint. |
Scaling
| Min-Max Scale | Rescale a numeric column to 0–1. |
| Standard Scale (Z-Score) | Standardize to zero mean and unit variance. |
| Robust Scale | Rescale using the median and interquartile range, resistant to outliers. |
| Max-Abs Scale | Divide by the largest absolute value, giving a range of [-1, 1]. |
Encoding
| Encode Column | Turn a categorical column into numbers using Label, One-Hot, or Frequency encoding. |
Aggregate & join
| Aggregate | Group rows by a column and compute sum, count, mean, min, max, or median. |
| Join Tables | Join in another table from a local file or a database connection. |
Data analysis
Tools that summarize the data and test hypotheses. They report results without altering the table.
Exploration
| Correlation Matrix | Pearson correlation between all numeric columns. |
| Outliers | Boxplot-based outlier detection for a column. |
| Feature Selection | Rank features by Correlation, Information Gain, or Variance. |
Statistical tests
| Normality Test | Jarque-Bera test for whether a column is normally distributed. |
| t-Test (Independent) | Welch's t-test comparing the means of two groups. |
| One-Sample t-Test | Does a column's mean differ from a hypothesized value? |
| Paired t-Test | Do two related columns (e.g. before / after) differ on average? |
| Z-Test (One-Sample) | Does a column's mean differ from a hypothesized value, using the normal distribution? |
| ANOVA (One-Way) | Do the means of three or more groups differ? Uses an F-test. |
| Chi-Square Test | Are two categorical columns statistically independent? |
| Mann-Whitney U Test | Compare two groups by rank, without assuming normality. |
| F-Test (Variances) | Do two groups have equal variances? |
| Levene's Test | Do two or more groups have equal variances? Robust to non-normal data. |
Survival analysis
| Kaplan-Meier | Estimate survival curves from a duration and an event column, optionally split by a group with a log-rank comparison. |
| Cox Proportional Hazards | Regress time-to-event on one or more predictors: hazard ratios, confidence intervals, significance, and concordance. |
Data visualization
Interactive charts built from the current state of your pipeline.
| Scatter Plot | Two columns against each other, optionally colored by a third. |
| Line Plot | One column against another as a line. |
| Bar Chart | Values as bars. Set Split By to compare two categorical columns: counts if Y-Axis is blank, otherwise the average Y-Axis per group. |
| Histogram | Frequency distribution of a single column. |
Modeling
Fit predictive models directly on the pipeline's output. Choose the predictor columns and the column to predict.
| Linear Regression | Predict a numeric Y from one or more predictors. Train/test evaluation, coefficient significance, and residual diagnostics. |
| Logistic Regression | Classify a binary Y. Train/test accuracy, ROC AUC, confusion matrix, and coefficient significance. |
| Random Forest | Regression or classification (auto-detected), with train/test metrics and permutation feature importance. |
| XGBoost | Gradient-boosted trees for regression or classification (auto-detected), with train/test metrics and permutation feature importance. |
| Time Series Forecasting | Forecast future values from a date/order column and a value column using moving average, linear trend, or exponential smoothing. |

AI assistant
Chat
Ask a question about your data in plain language. A local model converts it into SQL, and Pivot maps that into native work-stack steps rather than running a raw query, so you can see, edit, and reorder what it built. You can also pick Claude in the menu under the chat box; see Claude & the privacy mask.
Smart suggestions
Pivot computes "what to try next" hints from your live pipeline: flagging outlier-prone or high-null columns, or suggesting a chart after an aggregation. Suggestions that don't apply aren't repeated.

MCP server
Pivot can expose the whole work-stack pipeline as Model Context Protocol tools, so an external agent can build a pipeline programmatically instead of you dragging tools by hand.
Claude & the privacy mask
The chat can answer with Claude instead of the local model. Pick Claude in the menu under the chat box. Claude works in your Pivot window: it adds steps to your work stack, runs tests, models and charts, and replies in a sentence or two. The chat starts on the local model, so Claude is only used after you pick it.
What you need
- Claude Code, installed and signed in once, with a paid Claude plan or an Anthropic API account. Pivot uses that sign-in, so there's no API key to paste into Pivot.
- uv, which runs Pivot's tools for Claude. It installs with one command from docs.astral.sh/uv.
How the privacy mask works
The shield button next to the model menu turns the mask on and off. It's on by default. While it's on, Pivot replaces the text values in your data with tokens before anything reaches Claude, and puts the real values back when Claude answers.
- Your question is masked. Values from your data in your message are
replaced, so "orders from Jaipur" reaches Claude as "orders from
[city#1]". - Everything Claude reads is masked. Rows, SQL results, column profiles, step settings, result windows, history, error messages and the file name all reach Claude with tokens in place of values.
- Claude works with the tokens. When it adds a step such as Filter Rows on
[city#1], Pivot turns the token back into Jaipur before running it. The step in your work stack holds the real value. - The reply is unmasked for you. Claude writes "the top customer is
[customer#4]", and the chat shows you the real name.
A value gets the same token every time for as long as Pivot is open, so Claude can count, group and compare values without knowing what they are. The list that matches tokens to values stays inside Pivot on your computer, and is cleared when you close Pivot.
What is masked
| Text values | Masked. Names, emails, cities, product names, codes like ORD-1042, and new values your steps create, such as the result of Replace Text. |
| Identifier numbers | Masked. Number columns named like phone, mobile, account, card, Aadhaar, PAN, pincode or ID, and columns of long whole numbers that are nearly all different. |
| Pictures | Not sent. Charts and screenshots stay on your computer because they show labels. Claude still gets the text results of every test, model and chart. |
| Other numbers and dates | Sent as they are, such as amounts, ages, scores and order dates. Claude needs them to calculate. |
| Column names | Sent as they are, so Claude can choose columns for its steps. Rename a column first if its name is sensitive. |
Limits
- Only whole values are swapped. If you type part of a value yourself, such as just a surname, that part reaches Claude.
- Numbers and dates are visible to Claude, including in columns your steps leave out, because Claude can query the original file. If a number column is sensitive, like salaries, use the local model for that data.
- With the shield off, Claude sees your data as it is, including pictures of charts.
With the local model selected, nothing is sent anywhere. With Claude, what Claude receives goes to Anthropic under your own Claude account and its terms.
Sessions & export
- Save / load sessions. A
.pivotfile stores your pipelines, how the file was imported (including any columns you extracted), and your history, so you can pick up where you left off. - Autosave. Pivot saves your work as you go and restores it the next time it opens.
- Open and export. Load CSV or Excel files (see Importing files) and export your results back out as CSV.
- Change source. Run the same pipeline on a different file. See Changing the source.
- Refresh. Re-run the pipeline against the source file after it changes.
- Join from a database. Join Tables can bring in a table from a local file or a database connection.
Updates
Pivot can update itself. Click the Check for Updates icon in the toolbar at any time. The installed app also checks quietly shortly after it starts, and only speaks up when a newer version is available.
When a newer version is available, that toolbar icon turns blue and reads Update. If you choose Later in the update window, the blue button stays there so you can come back to it, and clicking it opens the update straight away.
- See what's new. A window shows the new version number and its release notes.
- Click Update now (or Later to skip it). Pivot downloads the update and verifies it hasn't been altered before installing anything.
- Pivot restarts itself. Your work is autosaved first, so it's all there when it reopens.
Updates use the same Google account you signed in with.
Privacy & your data
Pivot processes your datasets entirely on your own machine, and the AI assistant runs locally unless you pick Claude in the chat (see Claude & the privacy mask). We never see or store the data you load. The only times Pivot contacts our server are signing in, checking your subscription, and looking for updates. Your datasets are never sent. Read the full Privacy Policy.
Questions, or something missing from these docs? Email info@buildfromscratch.in, or start a free trial.