Explore, clean, visualize and model your data in one workspace on your own computer, from a messy CSV to a clear answer without hours of repetitive prep.
Free for 3 months. No credit card required.
Explore, clean, visualize and model your data in one workspace on your own computer, from a messy CSV to a clear answer without hours of repetitive prep.
Free for 3 months. No credit card required.
“Pivot reduced our data cleaning pipeline setup from hours to just minutes. Unbelievable tool!”
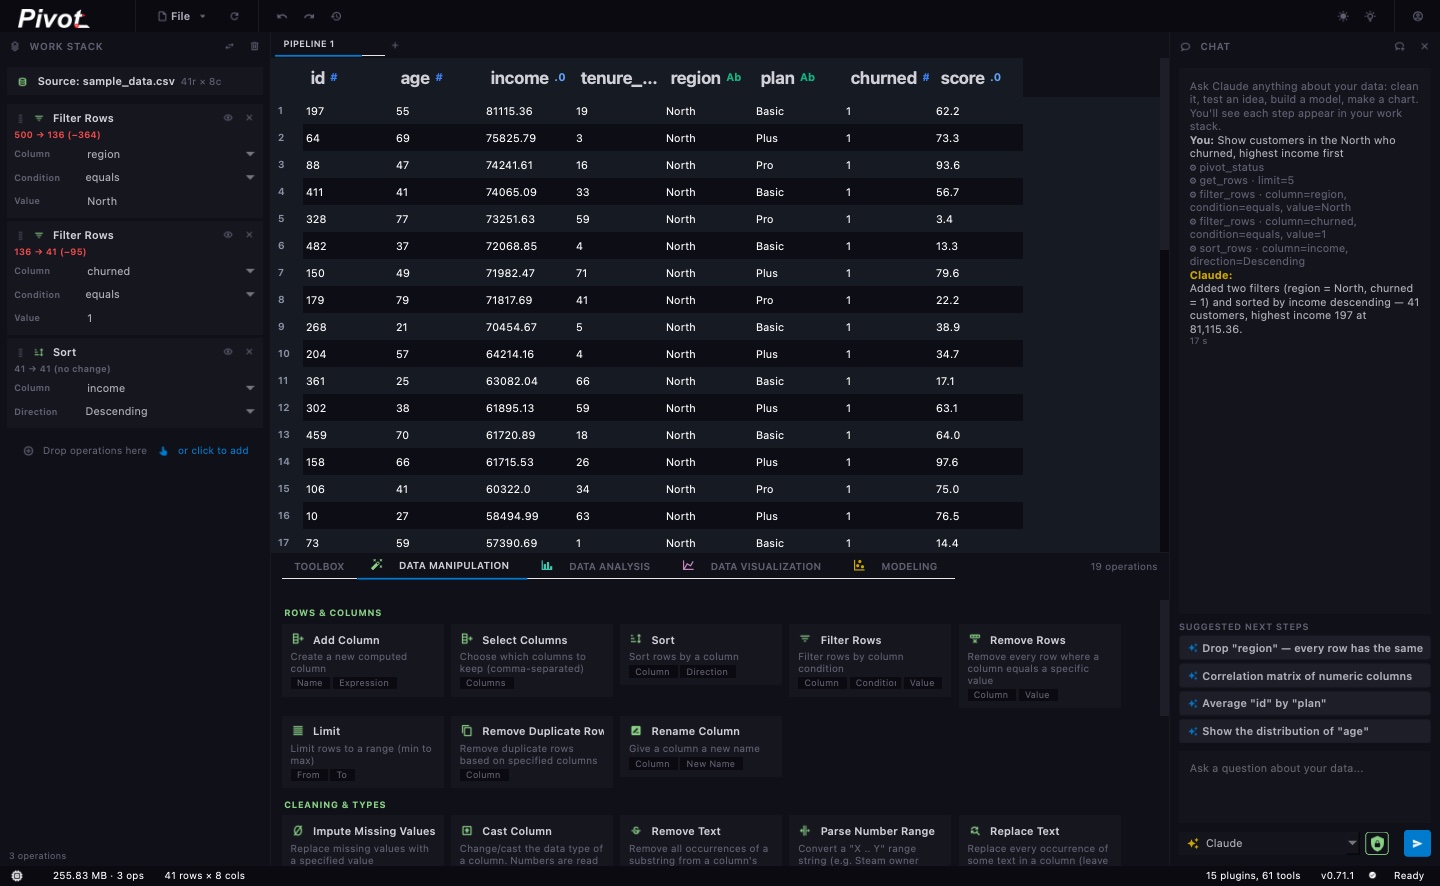
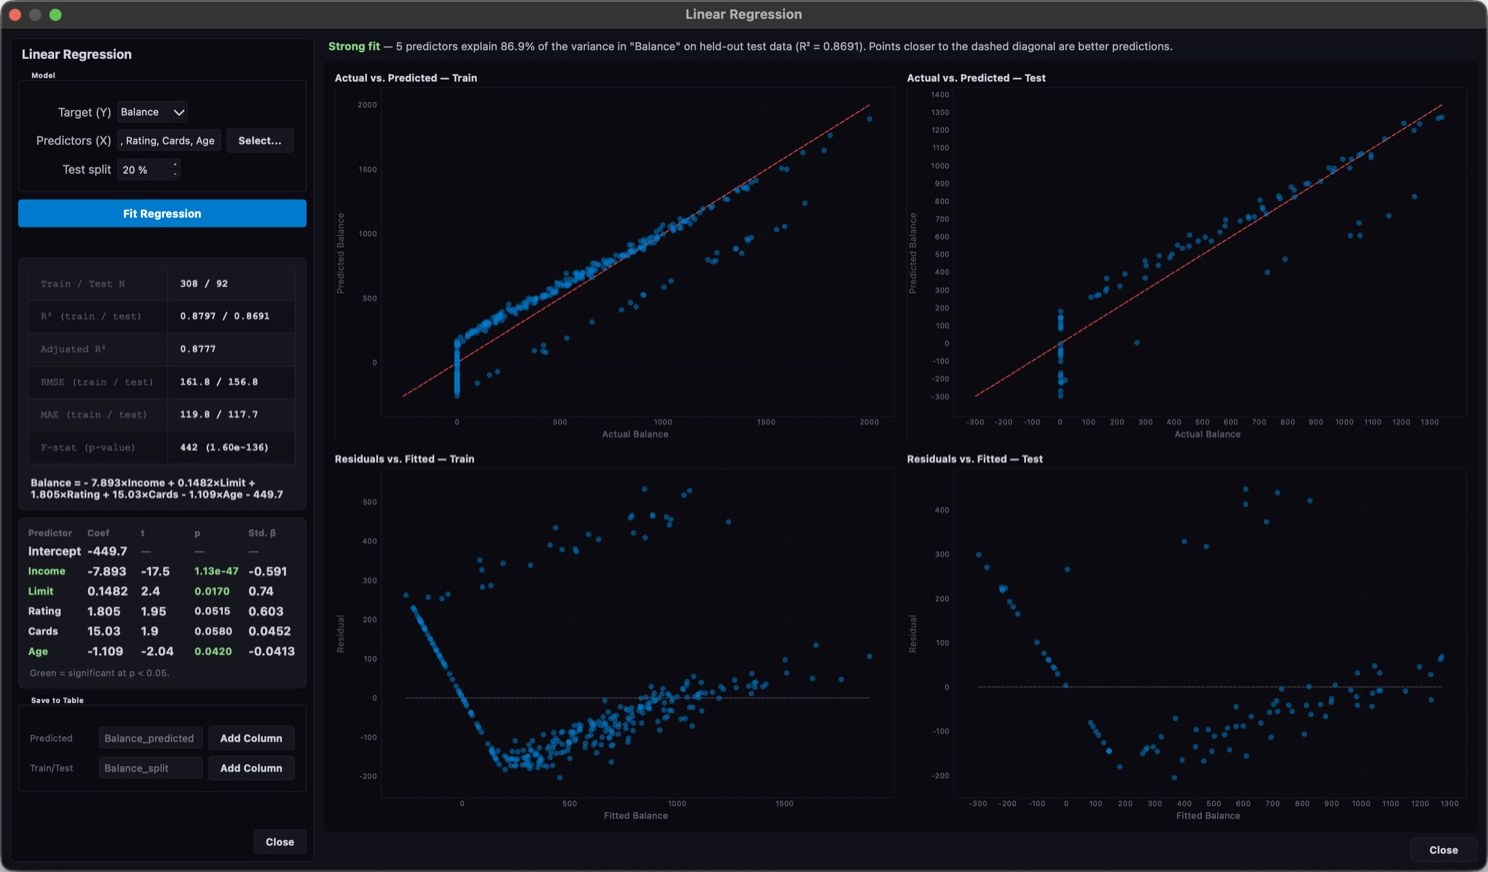
Real screens from Pivot. Build a pipeline, fit a model and chart the results, all in one place.
Stack tools into a pipeline, no code needed.
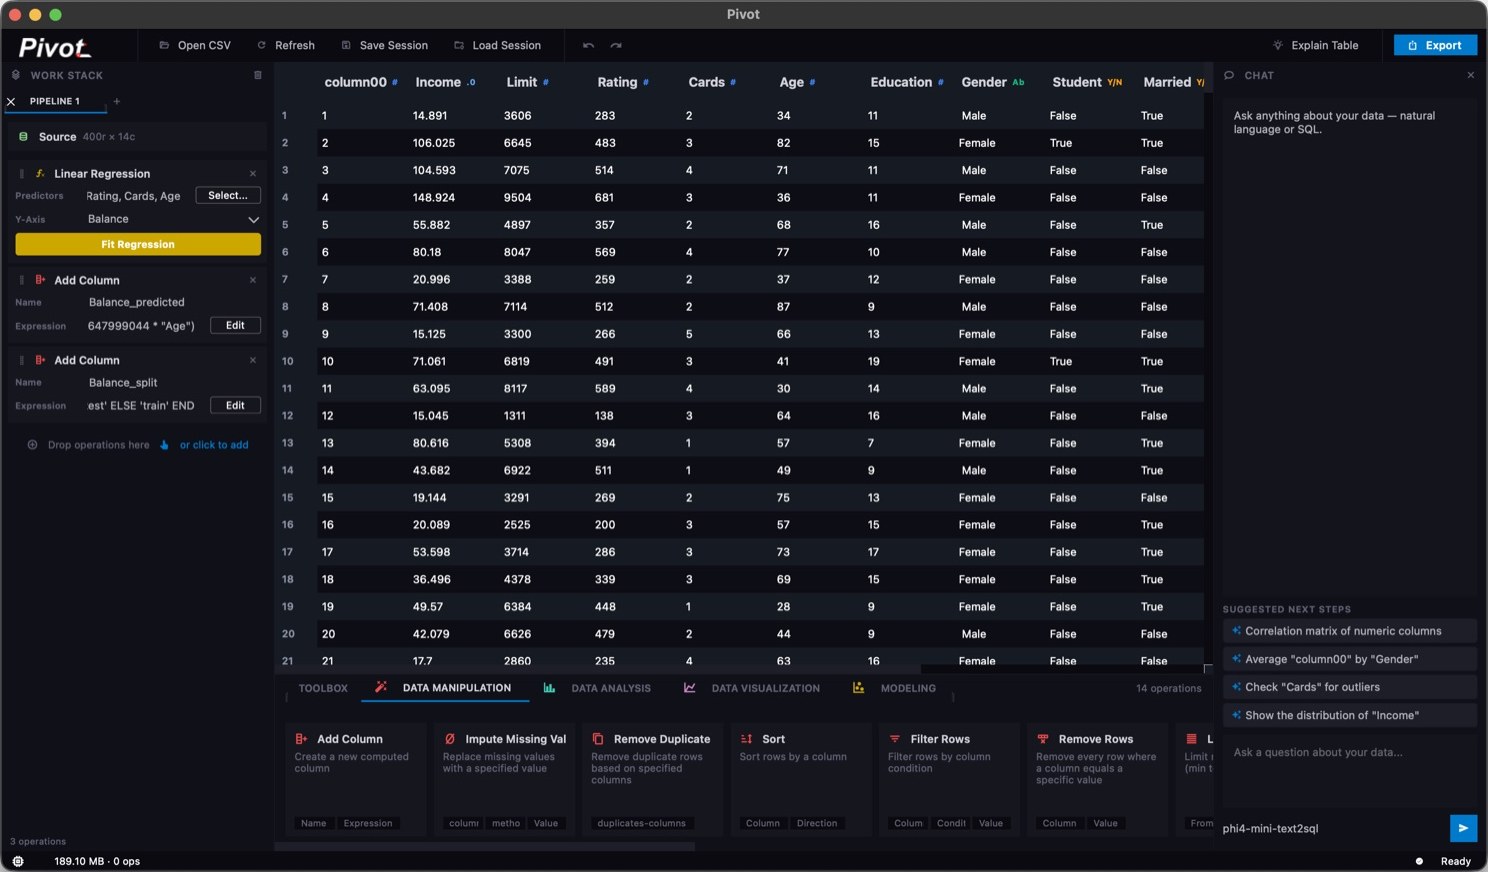
Ask in plain English, get a new step.
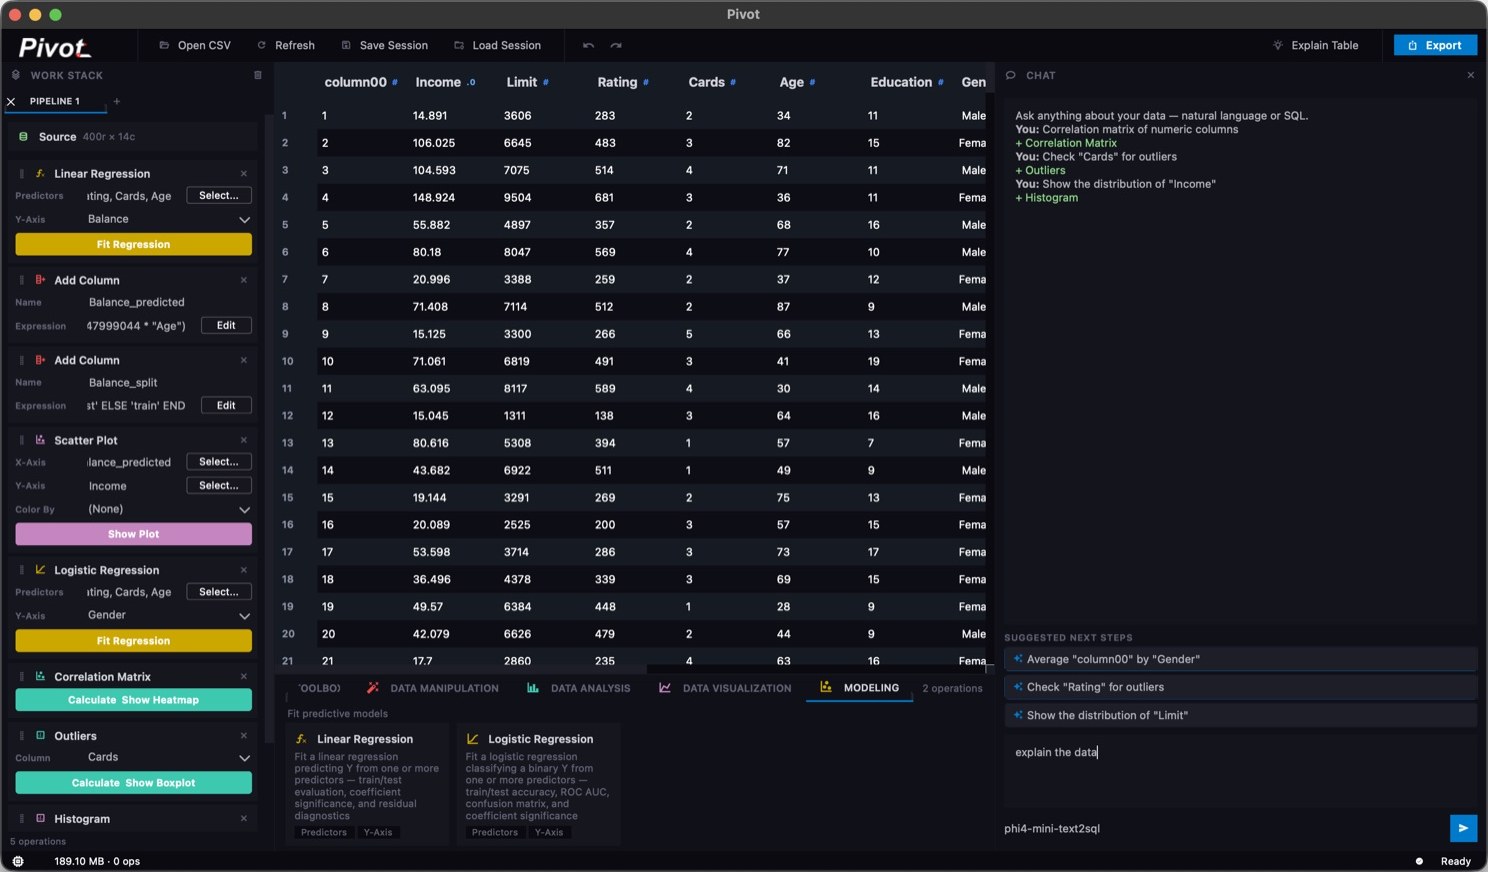
R², coefficients and residuals in app.
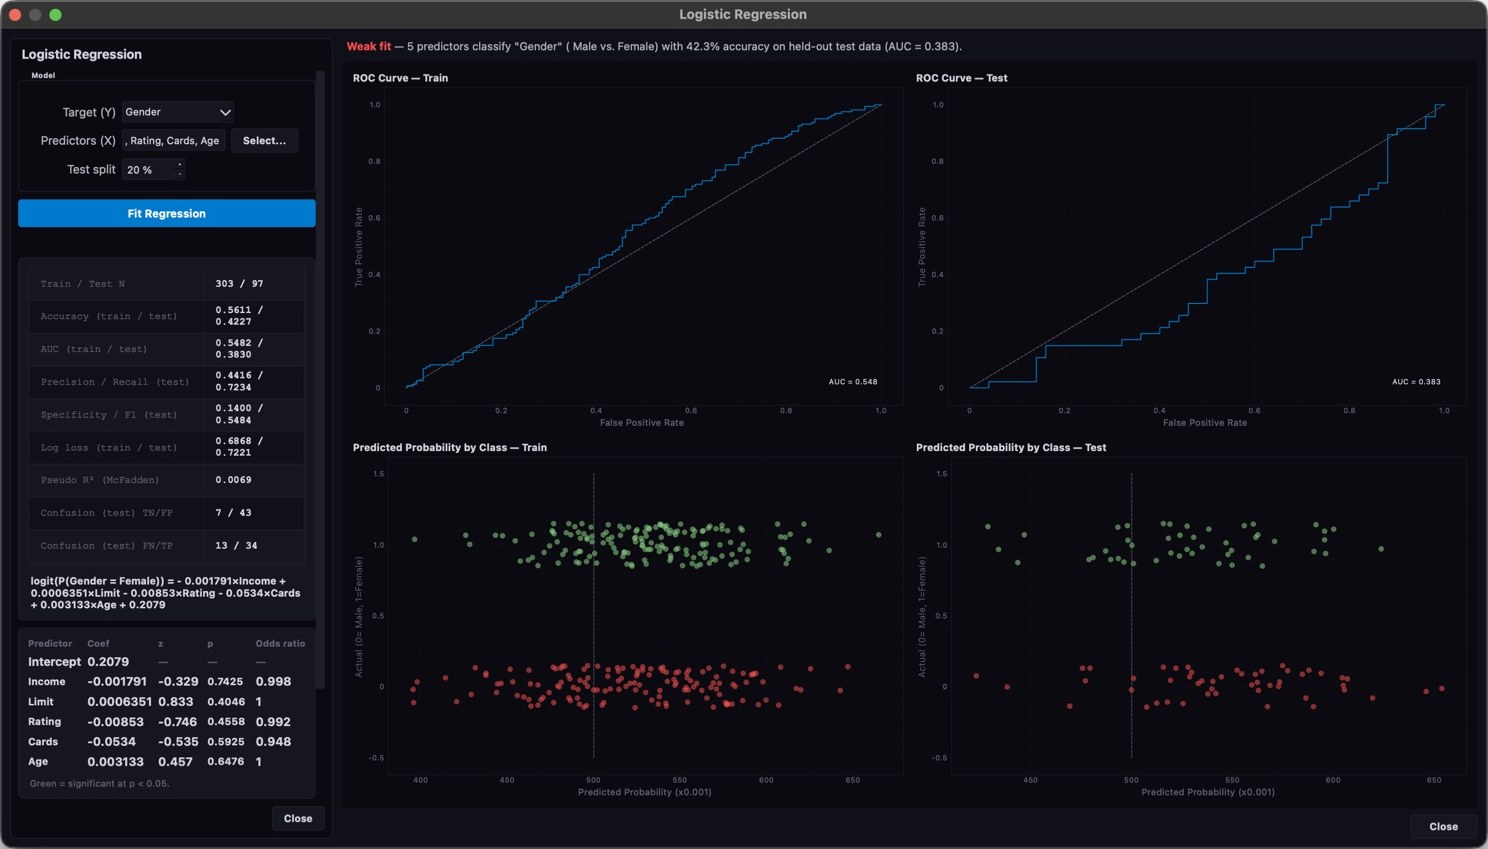
Accuracy, ROC AUC and a confusion matrix.
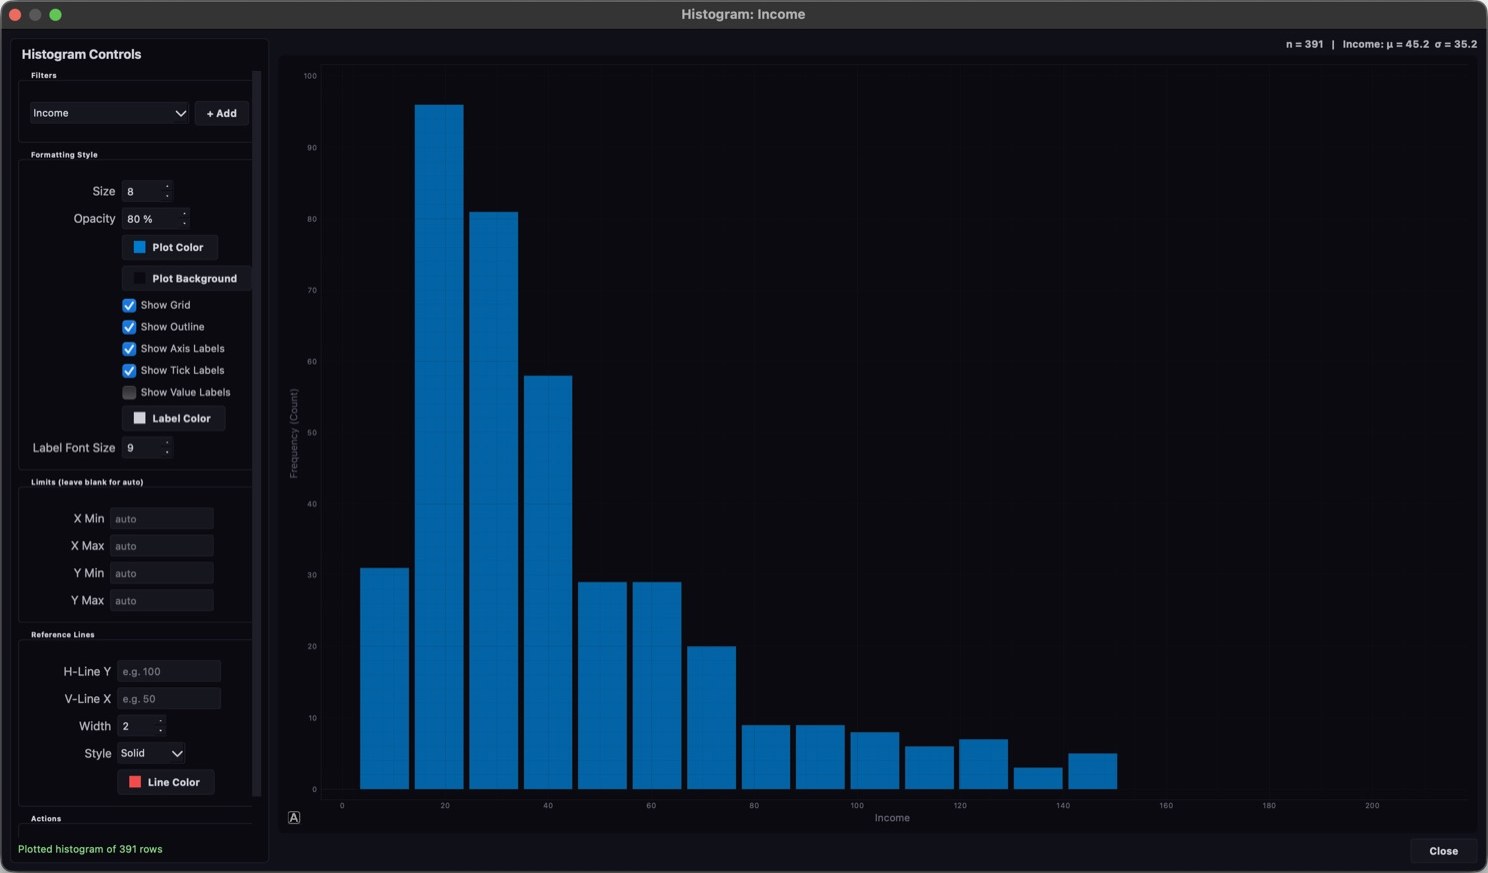
Histograms with mean and spread, instantly.
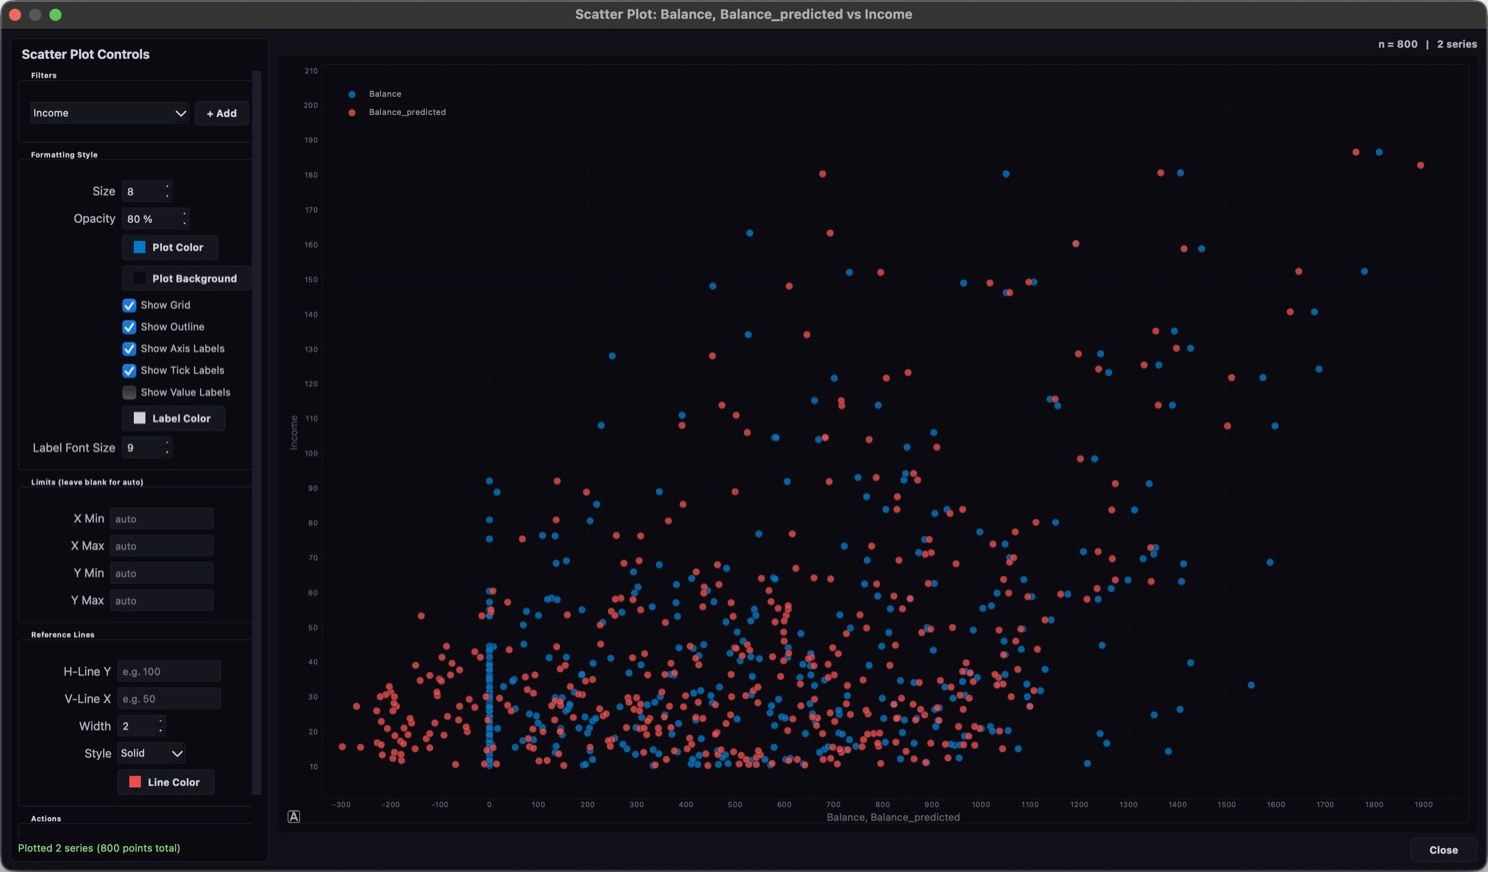
Compare actual vs. predicted on a scatter plot you can fully configure: colors, limits and reference lines.
Drop tools into a work stack. Every step stays reorderable and editable, and the pipeline re-runs live as you change it.
A DuckDB engine keeps data on disk and compiles each step into one query, so millions of rows stay fast.
Your datasets stay on your machine. The built-in AI assistant runs on a local model. Claude is optional, and by default text values reach it only as tokens.
Impute, dedupe, filter, cast, scale, encode and aggregate with over a dozen visual tools.
Correlations, outliers, t-tests, and linear and logistic regression with diagnostics, no notebook required.
Questions turn into work-stack steps, and an MCP server lets external agents drive the whole pipeline.
From cleaning to modeling to AI-assisted automation, the full toolset that ships with Pivot.
Create a new computed column from an expression.
Replace missing values with a specified value or method.
Remove duplicates based on specified columns.
Sort rows by a column and direction.
Filter rows by a column condition.
Remove every row where a column equals a specific value.
Limit rows to a range (min to max).
Choose which columns to keep.
Change or cast a column's data type.
Group by a column and compute sum, count, mean, min, max, or median.
Rescale a numeric column to a 0–1 range.
Strip all occurrences of a substring from a column's values.
Convert an "X .. Y" range string into its numeric midpoint.
Label, One-Hot, or Frequency encoding of a categorical column.
Pearson correlation between numeric columns.
Boxplot-based outlier detection.
Rank features by Correlation, Information Gain, or Variance.
Jarque-Bera test for normal distribution.
Welch's t-test comparing means of two groups.
With optional color-by column.
Track trends across ordered data.
Compare values across categories.
Visualize the distribution of a column.
Train/test evaluation, coefficient significance, and residual diagnostics.
Train/test accuracy, ROC AUC, confusion matrix, and coefficient significance.
A local phi4-mini-text2sql Ollama model converts your questions into SQL, then maps it back into native work-stack steps instead of running raw queries.
Deterministic "what to try next" hints computed from live pipeline stats — like suggesting a chart after an Aggregate, or flagging outlier-prone columns.
Exposes the entire work-stack pipeline as Model Context Protocol tools, letting an external agent drive the GUI programmatically instead of a human dragging tools manually.
Orchestrates the MCP server via a local Ollama model for agent-driven pipeline construction.
Fast filtering and a clean visual workflow, without writing a single line of boilerplate code.
Disk-backed and virtual until materialized.
Edit any step and the pipeline re-runs live.
Natural language to SQL, fully offline.
Plain-English explanations of the statistics and data cleaning behind your analysis, each with a worked example you can follow in Pivot, Excel or Python.
| Compare Pivot with |
|---|
| Pivot vs Excel |
| Pivot vs OpenRefine |
| Pivot vs Tableau Prep |
| Pivot vs Alteryx |
| Pivot vs Julius AI |
| Pivot vs KNIME |
| Pivot vs Power Query |
| Pivot vs SPSS |
| Pivot vs JMP |
| What Pivot does |
|---|
| Data cleaning |
| Work stack |
| Regression and machine learning |
| AI assistant |
| Claude in Pivot |
| Statistical tests |
| Charts |
More answers in the documentation, on the pricing page and in our comparisons with Alteryx, SPSS and Excel.
Pivot Desktop is data cleaning and analysis software that runs on your own computer. You build a drag-and-drop pipeline of steps to clean messy CSV and Excel files, run statistical tests, draw charts and fit machine learning models, and a local AI assistant can add steps from plain-English questions.
No. Your files are read and processed on your own computer, and the AI assistant runs a local model. Pivot only contacts our server to sign in, check your subscription and look for updates.
CSV, Excel (.xlsx and .xls), Parquet and JSON. Pivot runs on the DuckDB engine and doesn't load everything into memory, so it isn't limited to a spreadsheet's 1,048,576 rows; files with millions of rows are fine.
No. Every step is picked from a menu and configured with a few options, or added by asking the AI assistant in plain English. Each step's result shows up in a live table, so you can check it as you go.
t-tests (independent, paired and one-sample), z-test, one-way ANOVA, chi-square, Mann-Whitney U, F-test, Levene's test, normality tests, correlation matrices, outlier detection, Kaplan-Meier and Cox survival analysis, linear and logistic regression, random forest, XGBoost and time series forecasting.
Pivot runs on Windows and Linux today. The macOS version is in progress.
There's a 3-month free trial with every feature and no credit card. After that, the Individual plan is $22.50 a month or $212.50 a year, and students pay $100 a year with a university email.
For individual analysts, researchers and small teams, often yes. Pivot covers the common cleaning, joining, statistics and modeling work in a no-code pipeline, at a personal price. It doesn't have Alteryx's server and spatial tools or SPSS's full catalogue of procedures.
 “The visual dynamic exploration in Pivot helps us catch anomaly patterns way before model training.”
 “Easily the best investment our engineering team made this year for local data exploration.”